Caribbean Carnival Economic Impact 2025: $500M+ Revenue, Trinidad, Jamaica & Bahamas Data
Caribbean Carnival is far more than a cultural celebration, it is a multi-billion-dollar economic engine that drives tourism, employment, and consumer spending across the region. Together with the cruise industry, Carnival represents one of the largest tourism revenue drivers in the Caribbean. Our analysis of carnival economics across Trinidad & Tobago, Jamaica, the Bahamas, and Barbados reveals a combined annual impact exceeding $500 million, with significant multiplier effects throughout Caribbean economies.
Need primary data?
HRG conducts custom research on carnival economics, tourism revenue, and consumer spending across Caribbean. Get a scoped quote within 24 hours.
Caribbean Carnival Economic Snapshot 2025
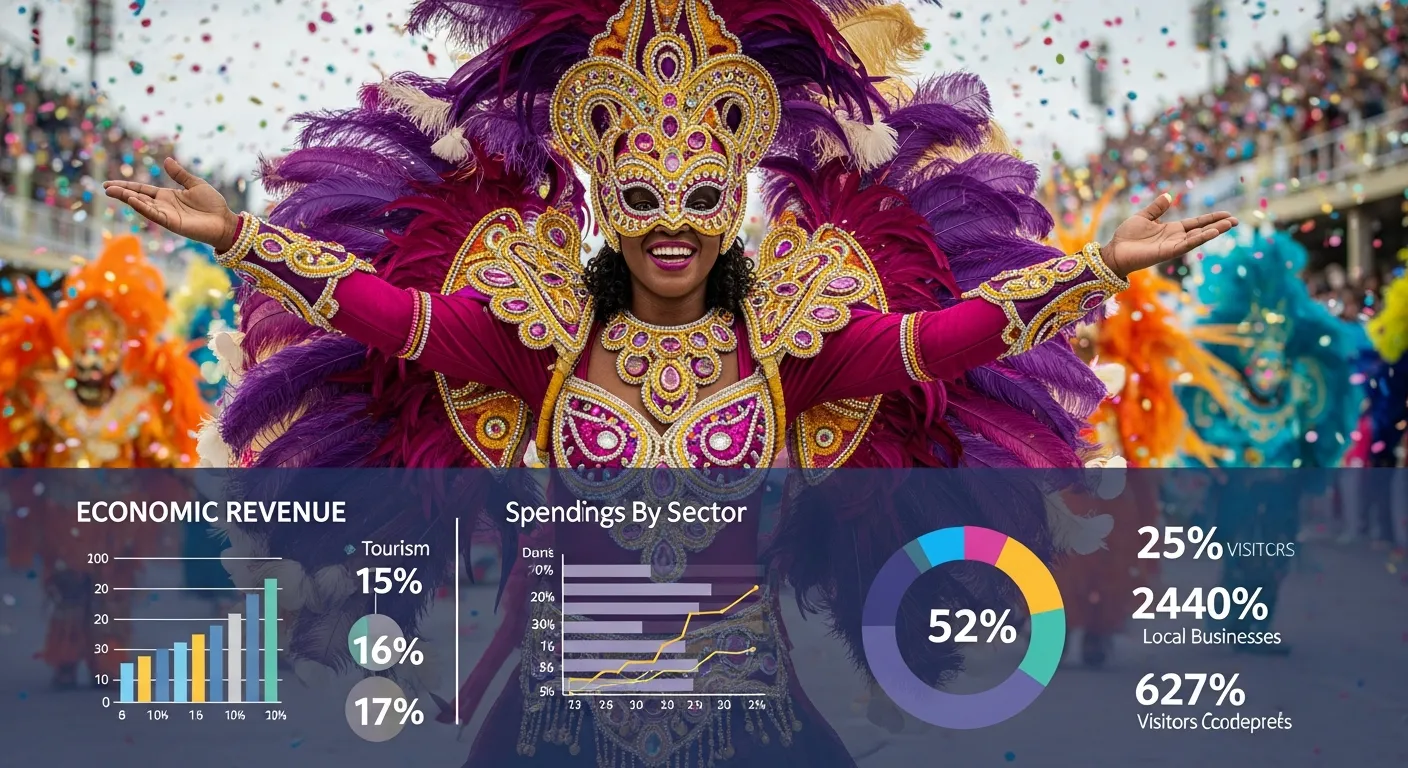
$500M+
Total annual carnival revenue across Caribbean
40,000+
International visitors to Trinidad Carnival
$3,200
Average international visitor spend
12,000+
Temporary jobs created regionally
Revenue by Market
Carnival economics vary significantly across Caribbean nations, reflecting differences in festival maturity, tourism infrastructure, and international brand recognition.
| Festival | Annual Revenue | Int'l Visitors | Growth Trend |
|---|---|---|---|
| Trinidad Carnival | $200M+ | 40,000+ | +8% YoY |
| Jamaica Carnival | $45M | 12,000+ | +15% YoY |
| Barbados Crop Over | $35M | 8,500+ | +10% YoY |
| Bahamas Junkanoo | $28M | 6,200+ | +5% YoY |
Caribbean Carnival Revenue & International Visitors
Sources: Trinidad & Tobago Tourism Ministry | CTO Festival Economics Report 2025 | HRG Event Analytics 2025
Trinidad Carnival: The Economic Powerhouse
Trinidad and Tobago's Carnival is the flagship Caribbean festival, generating over $200 million annually and serving as a major driver of foreign exchange earnings. With 40,000+ international visitors each season, the average visitor spend of $3,200 places it among the highest-yield tourism events in the region — significantly higher than the $104.36 average cruise passenger spend per port visit.
- Accommodation surge: Hotel occupancy reaches 98% during Carnival week, with rates increasing 60-80% above baseline
- Airline revenue: Caribbean Airlines and international carriers add 35+ additional flights during the season
- Costume industry: 150+ registered bands generate $60M+ in costume sales alone
- Fete economy: 300+ events over 6 weeks, generating $40M in ticket and beverage sales
Free Caribbean Market Assessment
Discover which research methodology best fits your Caribbean market entry strategy.
Jamaica Carnival: Fastest Growing
Jamaica Carnival has emerged as the fastest-growing carnival in the Caribbean, with revenue increasing 15% annually. The festival has successfully positioned itself as a premium experience, attracting affluent diaspora visitors and international tourists seeking a more intimate alternative to Trinidad, further contributing to the region's tourism and hospitality growth.
Visitor Spending Breakdown
How Carnival Visitors Spend Their Money
Caribbean Carnival Visitor Spending Breakdown (%)
Sources: HRG Event Spending Analysis 2025 | T&T Ministry of Tourism
Employment Impact
Carnival season creates over 12,000 temporary jobs across the Caribbean, providing critical income for artisans, performers, and service workers. The employment multiplier extends well beyond the festival period:
- Costume design & production: 4,500+ jobs (September - February preparation period)
- Event management & security: 2,800+ jobs during peak season
- Hospitality & food services: 2,200+ temporary positions
- Transportation & logistics: 1,500+ drivers, operators, and coordinators
- Music & entertainment: 1,000+ performers, DJs, and sound engineers
Corporate Sponsorship & Brand Investment
Corporate sponsorship of Caribbean Carnival events exceeds $80 million annually, with beverage companies, telecommunications firms, and financial institutions leading investment. Major sponsors include:
| Sector | Annual Sponsorship | Key Activities |
|---|---|---|
| Beverages | $32M | Fete sponsorships, brand activations, sampling |
| Telecommunications | $18M | Band sponsorship, digital activations, Wi-Fi zones |
| Financial Services | $15M | VIP experiences, cashless payment solutions |
| Other Sectors | $15M | Automotive, airline, retail partnerships |
Economic Multiplier Effects
For every $1 spent directly on Carnival activities, an estimated $2.80 circulates through the broader Caribbean economy. This multiplier effect impacts:
- Retail sector: Pre-carnival shopping season (January-February) drives 25% increase in retail spending on beauty, fashion, and fitness
- Real estate: Short-term rental income surges 300%+ during Carnival week
- Creative industries: Year-round employment for designers, musicians, and content creators
- Agriculture: Increased demand for local food products and beverages
Notting Hill & Diaspora Economic Impact
The Caribbean diaspora extends carnival economics globally. London's Notting Hill Carnival generates £300M+ for the UK economy while reinforcing Caribbean cultural brands and driving reverse tourism. Miami Carnival, Toronto Caribana, and New York's Labor Day Carnival collectively generate over $600M in diaspora markets, with significant reinvestment flowing back to Caribbean economies through tourism and remittances.
COVID Recovery & Future Outlook
The pandemic caused an estimated $1.2 billion in cumulative carnival-related losses across 2020-2022. However, recovery has been robust:
- 2024-2025 seasons reached 92% of pre-COVID revenue levels
- Virtual and hybrid event formats created new permanent revenue streams
- Online costume sales now represent 18% of total costume revenue
- International visitor numbers recovering, with 2025 projected to exceed 2019 levels
Pre-Carnival Shopping Season Impact (January-February)
The weeks leading up to Carnival create a distinct retail season comparable to holiday shopping in other markets:
- Beauty & personal care sales increase 40%
- Fitness & wellness spending rises 35%
- Fashion & accessories see 30% uplift
- Beverage alcohol sales surge 50% in the final two weeks
Frequently Asked Questions
How much revenue does Caribbean Carnival generate annually?
Caribbean Carnival festivals collectively generate over $500 million in annual revenue. Trinidad Carnival leads with $200M+, followed by Jamaica Carnival ($45M), Barbados Crop Over ($35M), and Bahamas Junkanoo ($28M).
What is the average visitor spend during Trinidad Carnival?
International visitors to Trinidad Carnival spend an average of $3,200 per trip, covering accommodation, costumes, food and beverages, entertainment, and transportation.
How does Carnival impact employment in the Caribbean?
Carnival seasons create over 12,000 temporary jobs spanning costume production, event management, hospitality, security, and transportation services.
What is the spending breakdown for Caribbean Carnival visitors?
Costumes 30%, accommodation 25%, food and beverages 20%, transportation 15%, and entertainment 10%.
How has COVID-19 affected Caribbean Carnival economics?
COVID caused $1.2 billion in cumulative losses from 2020-2022. Recovery has been strong, with 2024-2025 seasons reaching 92% of pre-COVID revenue levels.
Related Research
Caribbean Tourism Statistics 2025
Visitor arrivals, spending data & forecasts
Caribbean Consumer Behavior Trends
Shopping habits & brand preferences
Caribbean Holiday Shopping Trends
$2.8B seasonal retail spending analysis
Trinidad Consumer Trends 2025
Market insights for Trinidad & Tobago
Jamaica Consumer Trends 2025
Consumer spending & market data
Diaspora Consumer Research
Caribbean expat spending & influence
Caribbean Economic Data 2026
GDP by country, FDI data and sector breakdown across 21 Caribbean economies
Caribbean Cruise Industry Analysis 2025
Market share, port rankings & capacity data
Cruise Passenger Spending Analysis
$104.36 avg spend per port visit, FCCA/BREA data
Caribbean Tourism & Hospitality Trends
Visitor arrivals, hotel performance & tourism sector analysis
Need Carnival Season Market Research?
Our team specializes in festival economics, consumer spending analysis, and brand activation measurement across Caribbean Carnival markets. Get custom research tailored to your business needs.
Contact Our Research Teamcarnival economic impact Caribbean Research Report
Get our comprehensive carnival economic impact caribbean data pack with market analysis, competitive insights, and growth forecasts for strategic planning.